Dstat's output by default is designed for being interpreted by humans in real-time, however you can export details to CSV output to a file to be imported later into Gnumeric or Excel to generate graphs.
[dag@moria ~]# dstat --list
internal:
        aio, cpu, cpu24, disk, disk24, disk24old, epoch, fs, int, int24, io, ipc, load, lock,
        mem, net, page, page24, proc, raw, socket, swap, swapold, sys, tcp, time, udp, unix,
        vm
/usr/share/dstat:
        battery, battery-remain, cpufreq, dbus, disk-recsize, disk-tps, disk-util, dstat,
        dstat-cpu, dstat-ctxt, dstat-mem, fan, freespace, gpfs, gpfs-ops, helloworld,
        innodb-buffer, innodb-io, innodb-ops, lustre, mem-adv, memcache-hits, mysql-io,
        mysql-keys, mysql5-cmds, mysql5-conn, mysql5-io, mysql5-keys, net-packets, nfs3,
        nfs3-ops, nfsd3, nfsd3-ops, ntp, pcap-ssh, postfix, power, proc-count, proc-count2,
        proc-count3, qmail, rpc, rpcd, sendmail, snooze, squid, test, thermal, top-bio,
        top-bio-adv, top-childwait, top-cpu, top-cpu-adv, top-cpu2, top-cpu3, top-cputime,
        top-cputime-avg, top-int, top-io, top-io-adv, top-latency, top-latency-avg, top-mem,
        top-oom, top-tcp-ports, utmp, vm-memctl, vmk-hba, vmk-int, vmk-nic, vz-cpu, vz-io,
        vz-ubc, wifi
See the for options and a summary of each external plugin.
[dag@moria ~]$ dstat --help
Usage: dstat [-afv] [options..] [delay [count]]
Versatile tool for generating system resource statistics

Dstat options:
  -c, --cpu              enable cpu stats
     -C 0,3,total           include cpu0, cpu3 and total
  -d, --disk             enable disk stats
     -D total,hda           include hda and total
  -g, --page             enable page stats
  -i, --int              enable interrupt stats
     -I 5,eth2              include int5 and interrupt used by eth2
  -l, --load             enable load stats
  -m, --mem              enable memory stats
  -n, --net              enable network stats
     -N eth1,total          include eth1 and total
  -p, --proc             enable process stats
  -r, --io               enable io stats (I/O requests completed)
  -s, --swap             enable swap stats
     -S swap1,total         include swap1 and total
  -t, --time             enable time/date output
  -T, --epoch            enable time counter (seconds since epoch)
  -y, --sys              enable system stats

  --aio                  enable aio stats
  --fs, --filesystem     enable fs stats
  --ipc                  enable ipc stats
  --lock                 enable lock stats
  --raw                  enable raw stats
  --socket               enable socket stats
  --tcp                  enable tcp stats
  --udp                  enable udp stats
  --unix                 enable unix stats
  --vm                   enable vm stats

  --plugin-name          enable plugins by plugin name (see manual)
  --list                 list all available plugins

  -a, --all              equals -cdngy (default)
  -f, --full             automatically expand -C, -D, -I, -N and -S lists
  -v, --vmstat           equals -pmgdsc -D total

  --float                force float values on screen
  --integer              force integer values on screen

  --bw, --blackonwhite   change colors for white background terminal
  --nocolor              disable colors (implies --noupdate)
  --noheaders            disable repetitive headers
  --noupdate             disable intermediate updates
  --output file          write CSV output to file

delay is the delay in seconds between each update (default: 1)
count is the number of updates to display before exiting (default: unlimited)
Only in black and white :)
[dag@moria ~]# dstat
----total-cpu-usage---- -dsk/total- -net/total- ---paging-- ---system--
usr sys idl wai hiq siq| read  writ| recv  send|  in   out | int   csw
  5   0  93   0   0   0| 154k   84k|   0     0 |   0     0 |1081  1116
 13   0  87   0   0   0|   0     0 |   0     0 |   0     0 |1036   696
  8   0  92   0   1   0|   0  8192B|   0     0 |   0     0 |1073   936
  0   0  99   0   0   1|   0     0 |   0     0 |   0     0 |1072   940
  1   1  97   0   2   0|   0     0 |   0     0 |   0     0 |1252  1727
  1   1  98   0   1   0|   0     0 |   0     0 |   0     0 |1126  1191
  1   0  99   0   0   0|   0     0 |   0     0 |   0     0 |1045   908
  0   0  99   0   0   0|   0    44k|   0     0 |   0     0 |1051   904
  1   1  99   0   0   0|   0     0 |   0     0 |   0     0 |1036   850
  1   0 100   0   0   0|   0     0 |   0     0 |   0     0 |1029   757
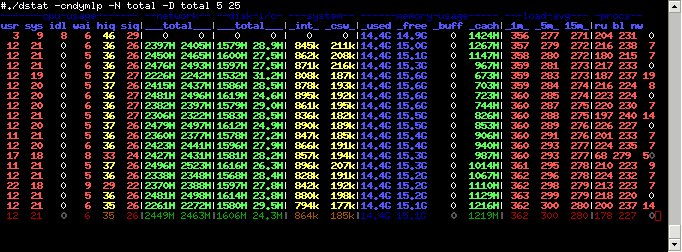
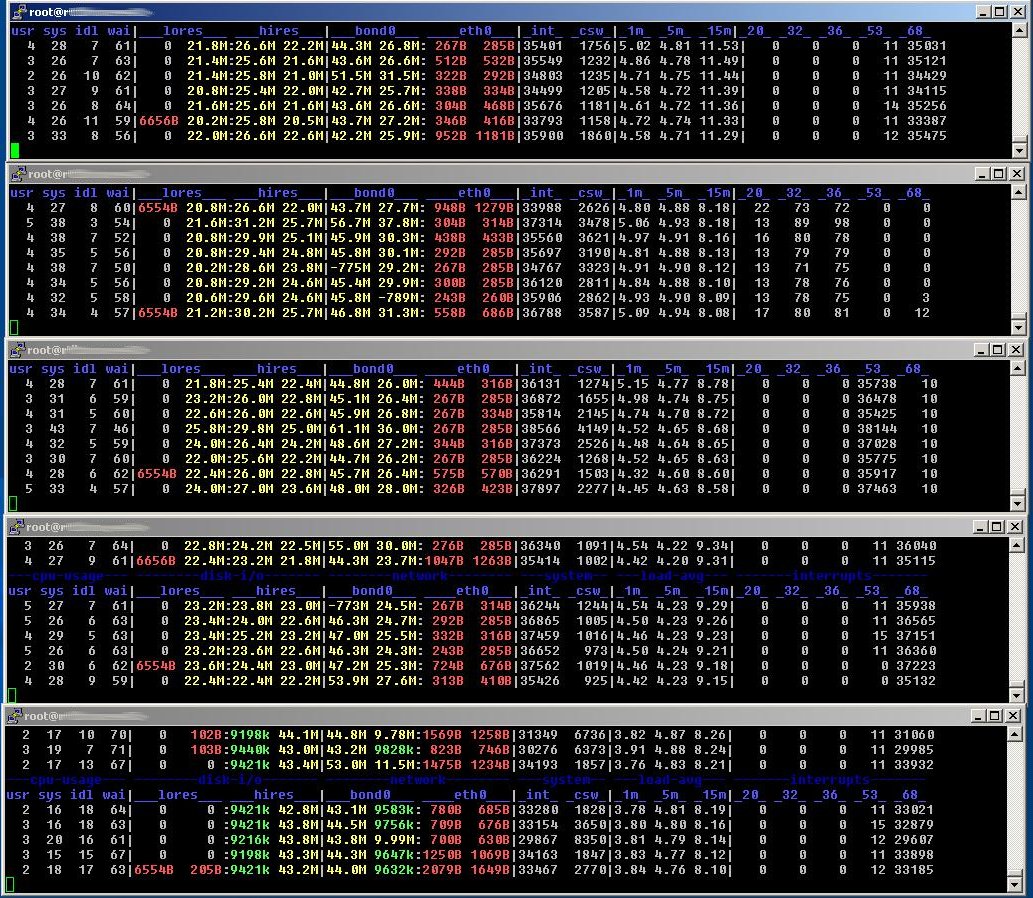
[dag@moria ~]$ dstat -c --top-cpu -d --top-bio --top-latency
----total-cpu-usage---- -most-expensive- -dsk/total- ----most-expensive---- --highest-total--
usr sys idl wai hiq siq|  cpu process   | read  writ|  block i/o process   | latency process
  5   0  94   0   0   0|firefox      3.6| 148k   81k|init [5]     98k   50B|pdflush        21
  2   1  98   0   0   0|wnck-applet  0.5|   0     0 |                      |at-spi-regist   5
  2   1  98   0   0   0|firefox      0.5|   0     0 |                      |Xorg            1
  1   2  97   0   0   1|                |   0     0 |                      |Xorg            1
  1   1  98   0   0   0|                |   0     0 |                      |ksoftirqd/1    10
  1   1  97   0   0   0|firefox      0.5|   0     0 |                      |ksoftirqd/0     5
  2   1  97   0   0   0|firefox      0.5|   0     0 |firefox       0    28k|ksoftirqd/0     5
  2   1  97   0   0   0|firefox      0.5|   0     0 |                      |Xorg            1
  1   1  97   0   0   0|firefox      0.5|   0     0 |                      |ksoftirqd/0     6
  2   1  98   0   0   0|firefox      0.5|   0     0 |                      |ksoftirqd/0     6
  1   2  98   0   0   0|                |   0     0 |                      |ksoftirqd/1     8
  2   1  98   0   0   0|iwlagn       0.5|   0    72k|kjournald     0    32k|ksoftirqd/1    12
  1   1  97   0   0   0|                |   0     0 |                      |iwlagn/0        1
  1   1  98   0   0   0|firefox      0.5|   0     0 |                      |ksoftirqd/1     8
Here are 2 screenshots of older dstat versions in action.
 If you've found a bug, please check the
for known problems and send me updates if you have more information to
provide.
If you've found a bug, please check the
for known problems and send me updates if you have more information to
provide.